5.2 Thermal Conditioning
Two types of thermal conditioning were used prior to vibration testing: a temperature soak and temperature cycling. A high and low temperature soak consisting of a dwell time of 24 hours at each of the temperature extremes, -55°C and 85°C, was used to enhance the stability of the optical cable by driving marginal parts of the assembly to failure. The temperature profile used is shown in Table 3. No failures were found following the soaks however it was observed that the OC-1008 cable stiffened with exposure to high temperature (85°C is the maximum rated temperature due to the material characteristics of the optical fiber coating).
Table 3. Thermal Conditioning Temperature Profile
Transition Time    Dwell Time     Temperature °C
    (hours)          (hours)
     Start                              25
      0.5                               85
                       24               85
      0.75                              25
       1                               -55
                       24              -55
      0.5                               25
5.2.1 Post Thermal Soak Visual Inspection
Following the thermal conditioning, a visual examination of the fiber end faces was performed at 400X, both with and without the use of backlighting. A significant number of features were noted on many of the fiber end faces and were attributed to the original termination process which left surface irregularities. Several of the end faces showed rough edges on the cladding outer diameters and pits in the core and cladding areas. One terminus appeared to have a crack or severe scratch in the fiber cladding. This feature was not seen in the interferometer photograph and is considered to be an artifact of the original polish, or a condition that might have evolved during thermal conditioning.
At this point in the evaluation, one cable was found broken inside the rear barrel of an SMA connector. This was attributed to insufficient capture of the cable jacket under the barrel that may have caused excessive mechanical strain to the fiber inside the SMA connector. This cable was replaced and subjected to thermal conditioning as described above. An inventory of the features found during the initial visual examination is given in Table III of Appendix A.
5.2.2 Optical Baseline Measurements (Post Thermal Soak Insertion Loss)
Over 380 measurements were taken to baseline the optical throughput for each channel, in each direction, using the sources and equipment that would be used in the vibration test. These measurements were derived from mV values read on a digital oscilloscope (using a optical to electrical converter) and were also taken directly from the display of a hand-held optical power meter (in dBm - dB referenced to mW)2.
The measurement repeatability during these tests was generally between 0 and 0.3 dB, although it varied up to 1.5 dB at times3. The "hands-on" experience showed that measurement repeatability was greatly affected by the compatibility between the threaded coupling mechanisms of the SMA connectors and the link hardware such as the connector adapters on the transceiver and on the optical-to-electrical (O/E) converter. The measurement variability associated with the connector on the O/E converter was insignificant while the connectors on the transceiver caused as much as 1.5 dB variability. The connector often became "locked" in position at some distance from the transmitter (even with the use of the 4 lb torque wrench) and could be re-mated to a position much closer to the transmitter. This aspect of connector loss seemed to be much more significant than the variability attributable to the lack of connector keying (consistent radial position with respect to the transmitter).
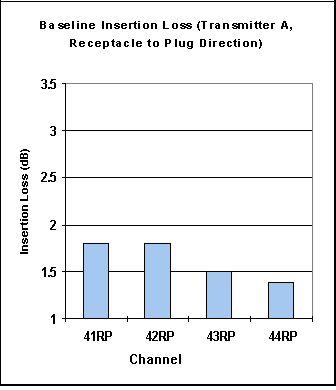
The baseline insertion loss data is shown in table form in Appendix
A. A graph of the insertion loss (using transmitter A, going in
the receptacle to plug direction for each of the four channels)
is shown in Figure 5. The data shows that the assembly provides
a total insertion loss that is within the limits specified for
the SMA connectors and M29504 termini combined (< 3.5 dB),
for each of the four channels. The very short length of the cable
contributes negligible loss to the link.
Table of Contents
 Next Section
 Up to TVA Homepage
 Back to the Library