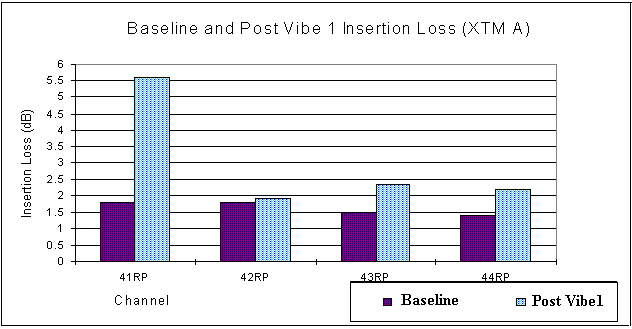
Insertion loss for the evaluation cable is shown in Figure 18 which compares the baseline value with the value recorded after the termini were reinserted into the connector, following post-vibration visual examinations and shrink tubing rework. This data represents the combined effects of repeated termini insertion and removal, handling, SMA non-repeatability and exposure to the temperature and vibration environments on channel loss stability. The large change in loss shown for channel 41, which was not seen immediately following the vibration test, indicates that the environmental exposures probably had less affect on the channel loss than the other factors noted above.
Although channels 42 through 44 showed a change in insertion loss
between 0.1 and 0.8 dB, they stayed well below the manufacturer's
ratings of 3.5 dB maximum. A review of the data indicates that
the insertion loss for channels 43 and 44 increased after thermal
cycling by about 0.2 dB which may correspond to the overall increase
in surface features noted at that time. The factors noted above
such as repeatability, handling and changes in radial alignment
between the terminus pairs may account for an additional portion
of the 0.8 dB increase in insertion loss. It is interesting to
note that even though the fiber end faces for both the pin and
socket for channel 42 saw significant increase in surface features
over the duration of the test, channel 42's optical data was the
most stable throughout the testing.
Table of Contents
 Next Section
 Up to TVA Homepage
 Back to the Library